The stats approach that changed my (at least scientific) life

Featured

I first had the idea of this blog when repeatedly reading Reviewers’ comments about the stats used in our papers, i.e., the progressive approach based on inferences and magnitudes (http://www.sportsci.org/resource/stats/index.html). While it is impossible for me (and Alberto at least) to go backwards and use the traditional approach (based on P values), there is still still some work to do for this essential approach to be understood/accepted by the sport science community !! Have a look at the following posts, and enjoy ! Nonetheless, we will keep fighting !

sportscienceHopkins – How to Interpret Changes in an Athletic Performance Test Hopkins – Progressive statistics in sports… Batterham – Making Meaningful Inferences about magnitudes

tns_cover_240

nb: New comments will be pasted as they will be received. Comments received before the blog was created are inserted with their respective dates and details.

Thanks for this, this helps a lot…

Featured

I will also post here the best general comments received, including those from reviewers who haven’t read the paper but ask what was already written in full in the text, or those questioning a concept or a methodological point that has been well accepted for ages. All others unspecific and useless comments will also be shown (e.g., the discussion needs to be rewritten !! soooo helpful).
nb: New comments are pasted as they are received. Comments received before the blog was created are inserted with their respective dates and details.

Rather than reinvent the statistical wheel, it would have been nice to simply report the results in a conventional way

Featured

[one of my favorites…]

Rather than reinvent the statistical wheel, it would have been nice to simply report the  results in a conventional way so that they would be comparable to the bulk of work in the field.

Journal of Applied Physiology (18/06/2012).

Paper still under review somewhere else

Please justify why the authors used this qualitative approach

“Data were analyzed using a magnitude-based inference approach for all parameters.” Please justify why the authors used this qualitative approach instead of the general descriptive statistical analysis.

Paper rejected from MSSE, 14/04/15

[my question to the reviewer is straightforward: Please justify why the reviewer is suggesting us to use the null-hypothesis significance testing (NHST) approach instead of the general qualitative approach]

Use first ‘conventional’ statistics’ before explaining the results with the ‘magnitude-based’ statistics

“Statistics : it might be interesting to first use ‘conventional’ statistics – before explaining the results with the ‘magnitude-based’ statistics, especially since some of the variables that are used to explain the training status of the subjects only show very small differences.”

Paper rejected from MSSE, 14/04/15

[what most people have not understood yet, it that with null-hypothesis significance testing (NHST), small differences can still be significant although being non substantial practically, just because of a large sample size!! for this reason (among others) MBI is necessary]

One should have p-value to say whether the conditions were statistically different or not

This reviewer dislikes the approach that likelihoods are reported. One should have p-value to say whether the conditions were statistically different or not. [But I don’t really want to know whether the differences are significant or not, I rather want to know how big there are, and how confident I can be in assessing that magnitude….. so why should I report P values?]

Frontiers in Physiology (rev#2) 23/02/15

The statistical presentation makes it impossible to really evaluate the results of the manuscript.

The statistical treatment and presentation in the manuscript is very difficult to understand. Instead of the most common approach of selecting a significance level (0.05) and judging comparisons based on the significance level, the authors use a range of qualitative descriptors based on confidence limits. Therefore, even if clear hypotheses were presented by the study [this is another discussion, but stating apriori hypotheses is highly questionable since it often refers to yes-or-now types of answers – I prefer examining magnitude of effects for example], they could not be tested, only deemed more or less certain. The other main problem with the statistical approach and its presentation is that the focus is on the level of “certainty” of the comparisons, instead of on the importance of any differences that are found. The statistical presentation makes it impossible to really evaluate the results of the manuscript.

Frontiers in Physiology (Rev #1), 23/02/2015.

Try to use more basic statistical calculations, because I don’t understand

“To be honest I did not understand your finding as given in page x, Line xx, xx,xx. I prefer to see raw data instead of detailed calculation results. Try to use more basic statistical calculations.”

[We presented adjusted % changes in performance responses to 2 training protocols, to remove the effect of a co-variable (baseline training status). Conclusion: make sure your analyses are simple enough for reviewer to understand what they are meant to judge…but hold on.., what about in-depth analysis? Na… too complex for reviewer = not worth publishing!?]

 J Sport Sci & Med 25/1/14

Publication Bias: Why P values are hopeless (again)

Publication BiaisKühberger A, Fritz A, Scherndl T. Publication Bias in Psychology: A Diagnosis Based on the Correlation between Effect Size and Sample Size. PLoS One. 2014 Sep 5;9(9):e105825. doi: 10.1371/journal.pone.0105825. eCollection 2014. Full text here

The negative correlation between effect size and samples size (left, with small samples, only large effects are published because small effects are generally non significant while they could be substantial in magnitude), and the biased distribution of p values (right, people only publish significant findings, ignoring the studies showing a lack of effect – or unclear because not enough power) indicate pervasive publication bias in the entire field of psychology.

On the importance of the smallest worthwhile change determination

This paper shows how the determination of the SWC affects the interpretation of the magnitude of the changes in monitoring variables
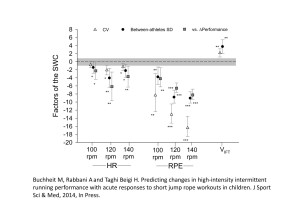
Figures J Sport Sci & Med (Large)

Buchheit M, Rabbani A and Taghi Beigi H. Predicting changes in high-intensity intermittent running performance with acute responses to short jump rope workouts in children. J Sport Sci & Med, 2014, In Press.

The aims of the present study were to 1) examine whether individual HR and RPE responses to a jump rope workout could be used to predict changes in high-intensity intermittent running performance in young athletes, and 2) examine the effect of using different methods to determine a smallest worthwhile change (SWC) on the interpretation of group-average and individual changes in the variables. Before and after an 8-week high-intensity training program, 13 children athletes (10.6±0.9 yr) performed a high-intensity running test (30-15 Intermittent Fitness Test, VIFT) and three jump rope workouts, where HR and RPE were collected. The SWC was defined as either 1/5th of the between-subjects standard deviation or the variable typical error (CV). After training, the large ≈9% improvement in VIFT was very likely, irrespective of the SWC. Standardized changes were greater for RPE (very likely-to-almost certain, ~30-60% changes, ~4-16 times > SWC) than for HR (likely-to-very likely, ~2-6% changes, ~1- 6 times >SWC) responses. Using the CV as the SWC lead to the smallest and greater changes for HR and RPE, respectively. The predictive value for individual performance changes tended to be better for HR (74-92%) than RPE (69%), and greater when using the CV as the SWC. The predictive value for no-performance change was low for both measures (<26%). Substantial decreases in HR and RPE responses to short jump rope workouts can predict substantial improvements in high-intensity running performance at the individual level. Using the CV of test measures as the SWC might be the better option.

Key words: submaximal heart rate; rate of perceived exertion; OMNI scale; 30-15 Intermittent Fitness Test; progressive statistics.